Node Graph
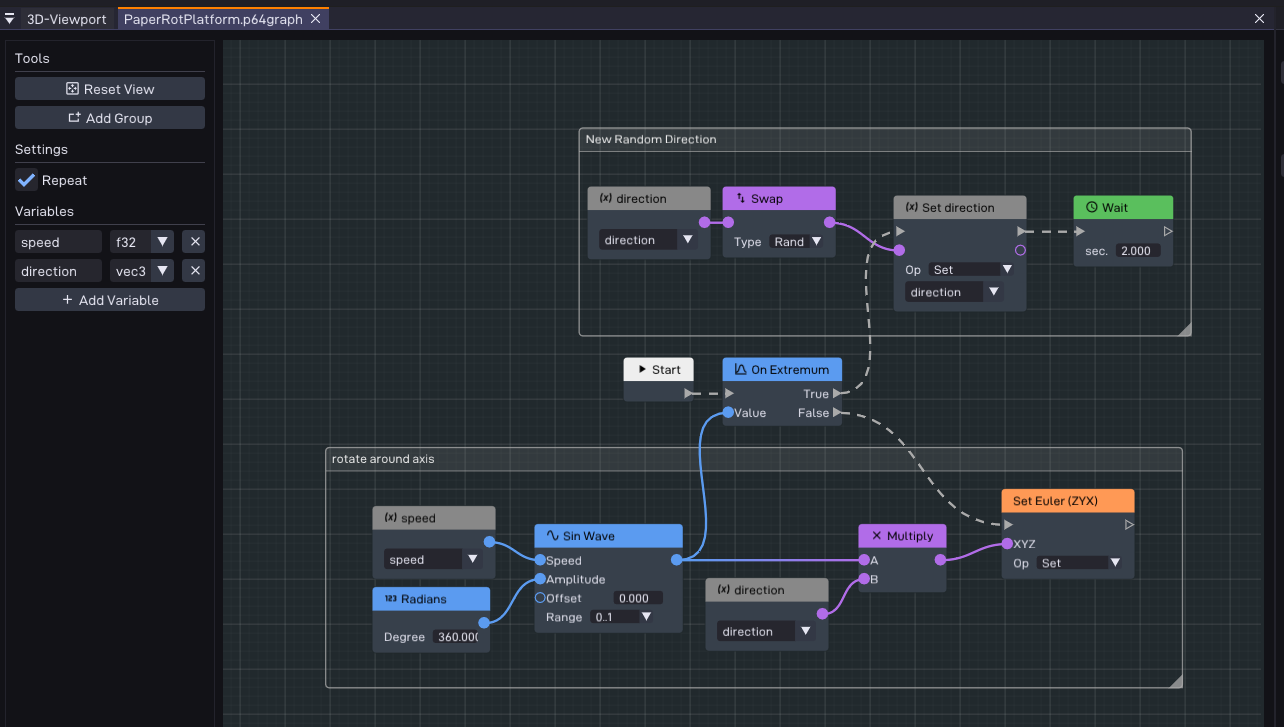
A node graph is a visual way to script object behavior, an alternative to writing an object-script in C++. You build the logic by placing nodes and wiring them together. The editor turns the graph into C++ that runs at game time.
Creating a graph
A graph is attached to an object through its Node Graph component:
Select the object and add a Node Graph component.
Press Create and give the graph a name. This makes a new graph asset.
Press Edit to open it in the graph editor.
The same graph asset can be reused on any number of objects.
The editor
The editor is a canvas of nodes connected by wires.
Add a node: right-click an empty spot to open the create menu, grouped by category.
A search box at the top is focused immediately, type to filter all nodes into a flat list.
You can also drag a wire out of a pin and release it on empty space to create a node already connected to it. The menu then lists only nodes with a pin that can accept the wire (compatible types or an automatic conversion).Connect nodes: drag from an output pin to a compatible input pin.
Route a wire: click anywhere on a connection to drop a draggable point, then move it to bend the wire around nodes. Drag a point to reposition it, double-click a point to remove it. A wire with no points keeps its automatic route.
Edit a node: its properties are shown directly on the node.
Select multiple: drag a box on empty canvas to select every node inside it.
Duplicate or remove: right-click a node.
Reset View: the Tools section of the left panel has a Reset View button that frames all nodes in the canvas.
Group nodes: Tools > Add Group drops a titled outline box. Drag its title bar to move it (any node inside moves with it), drag the bottom-right corner to resize, and double-click the title to rename. Grouping is soft and visual only: a node belongs to a group just by sitting inside it, dragging a node out detaches it, and deleting the group (select it and press Delete) leaves the nodes in place.
Repeat: the checkbox above the variables panel makes the graph loop. When any flow path ends, the graph waits a frame and restarts at Start (the same as wiring a Wait Frame back to the beginning). With it off, a finished path just ends.
Changes are saved with the graph asset.
Logic and value flow
There are two kinds of wire, and telling them apart is the key to reading a graph.
Logic wires (grey, drawn as an animated dashed line) define the order things happen.
Execution begins at the Start node and follows the logic wires from one node to the
next, the dashes flow in the direction control travels. A node runs, then hands control
to whatever its logic output connects to.
Value wires carry a computed value into a node that needs one, for example the number to compare or the object to send an event to. Value nodes are evaluated on demand wherever their result is used, so a chain of value nodes (say a couple of numbers feeding an Add feeding a Compare) resolves into a single computation at the point it is read.
Each value pin has a data type (integer, float, vector, object reference, …) and its colour reflects that type. You can only connect compatible pins: the numeric types convert into one another automatically, while a vector or object reference cannot be wired where a number is expected. See Custom Graph Nodes for the full list.
A node can mix both: it may run as part of the logic flow and also take values in on its value pins.
The two kinds also connect differently:
A logic output goes forward to a single node, but many nodes can converge into one logic input. Wiring a logic output somewhere new moves it there.
A value output can feed many inputs, but each value input takes a single source. Wiring a new value into an input replaces the old one.
Builtin nodes
The editor ships with a set of nodes, grouped by category in the create menu:
Category |
Nodes |
|---|---|
Flow |
• Start (entry point) |
Value |
• Int |
Math |
• Add |
Vector Math |
• Add |
Quat Math |
• Rotate Axis (quaternion from an axis + angle in radians) |
Easing |
• Ease (easing curve over t, with the input clamped to 0..1 and the output in 0..1) |
Wave |
• Sin Wave |
Object |
• Send Event (message another object) |
Scene |
• Load Scene |
Logic |
• Function (call a registered user function) |
Variables |
• Get Var (read a variable) |
Debug |
• Log Int / UInt / Float / Vec3 / Quat / Object: print a value through the engine log. Each has a text field whose contents are printed before the value (a label). |
Other |
• Note (a comment box) |
Every scalar value input (a number: int, uint or float) shows a small editable field on the node while nothing is wired into it, so you can type a constant directly. Connect a value wire and the wire takes over and the field disappears. Disconnect it and the field returns. Some nodes also expose other typed-in properties (a scene picker, a dropdown) that behave the same way.
Note
Graph clock: each graph instance keeps its own elapsed time, used by the Wave nodes. It advances while the graph is running but is frozen whenever the graph waits (a Wait / sleep does not advance it), so waves stay continuous across pauses instead of jumping ahead.
Variables
A graph can declare named, typed variables that persist for the whole run and can
change over time (the graph runs as a coroutine, so a variable keeps its value across
Wait / Wait Frame).
Declare them in the Variables panel on the left of the editor (a name and a type: Int, UInt, Float, Vec3, Quat, or Object).
Read / write them with the Get Var and Set Var nodes: choose the variable from a dropdown and the value pins take its type. Set Var has an Op (Set, Add or Subtract) and outputs the resulting value, so a single node both assigns and increments (handy for chaining, e.g. a per-frame counter).
Per-object defaults: each declared variable appears on the Node Graph component of every object using the graph, where you set its starting value. For an Object-typed variable that is an object picker, so the same graph can target different scene objects per instance.
Object references are simply variables of the Object type: declare an Object variable, set its target per object on the component, and read it with Get Var.
Note
The older standalone Object node is deprecated in favour of Object variables and is hidden from the create menu. Existing graphs that use it still work.
Extending the editor
The builtin nodes are themselves defined by scripts, and you can add your own nodes for a project: see Custom Graph Nodes.
See also
Node Graph component: the component options.
P64::Comp::NodeGraph: the runtime component in the C++ API.